Why we monitor sources of nutrients in rivers
We monitor the river nutrient sources as an indicator of the effects human activities have on our rivers. Nutrient loads from people’s activities can affect how suitable our rivers are for aquatic plants and animals to live in. They can also affect their suitability for swimming.
This indicator is a measure of the annual average input of nutrients to rivers from:
- background or ‘natural’ sources
- moderate to large point sources (usually town sewage and industrial waste water)
- developed land (non-point sources).
Loads (amounts) of nutrients are expressed per hectare of catchment. This is to allow comparison between point and non-point sources of nutrients and between catchments of different sizes. At this stage, the indicator is restricted to the plant nutrients nitrogen and phosphorus in three of the larger rivers in the Waikato region.
What's happening?
Generally, the background (natural) loads of the plant nutrients nitrogen and phosphorus in our rivers are low.
Most of the nutrients in our water come from human activities, which can be separated into point and non-point sources.
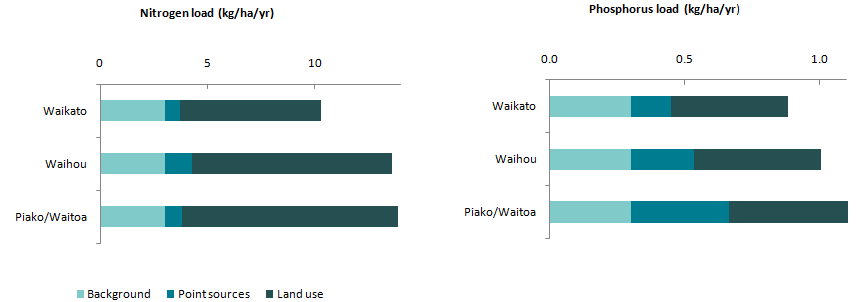
Nitrogen loads from point sources are low in the four major Waikato rivers and are similar to background levels. But the nitrogen loads from non-point sources are high, particularly in the intensively farmed Waihou, Waitoa and Piako River catchments. The loads tend to be highest in areas of intensive dairy farming.
Usually, the phosphorus loads from point sources and non-point sources on developed land are similar to the background loads. But during 2000 - 2009, the point source load of phosphorus to the Waitoa River was particularly high. In 2009, the load fell to about one-quarter of that shown in the graph below because of changes in waste water management at a site on the river.
Methods - How we monitor
Results - data and trends
Download the data file
This Excel spreadsheet contains the source data to this indicator's graph and any additional data. Data were collected from 2003–12 in the Waikato River and 2000–09 for the Waihou and Piako/ Waitoa rivers).
When this indicator is updated
There are no plans to update this indicator at present.


