Physical activity

 PHYSICAL ACTIVITY
| WORSENING TREND |
Frequency of doing physical activity in the Waikato region is lower in 2024 compared to 2006.
This indicator is the percentage of people living in the Waikato region who reported that they were physically active on five or more days of the past seven days. It uses data from the Quality of Life Survey.
Why is this indicator important?
Participation in sport and active leisure has positive benefits for people’s physical fitness and mental wellbeing, as well as being a source of enjoyment and entertainment. According to the New Zealand Heart Foundation, an active lifestyle can help reduce the risk of preventable diseases, including coronary heart disease, stroke, type 2 diabetes, obesity and some cancers. It can also provide benefits for people and the wider community through improved mental health, community life, social wellbeing and community safety.
Measuring people’s reported levels of physical activity and taking account of their impact upon these other areas can also help us to plan for current and future support systems and other resources within in our region.
Physical activity
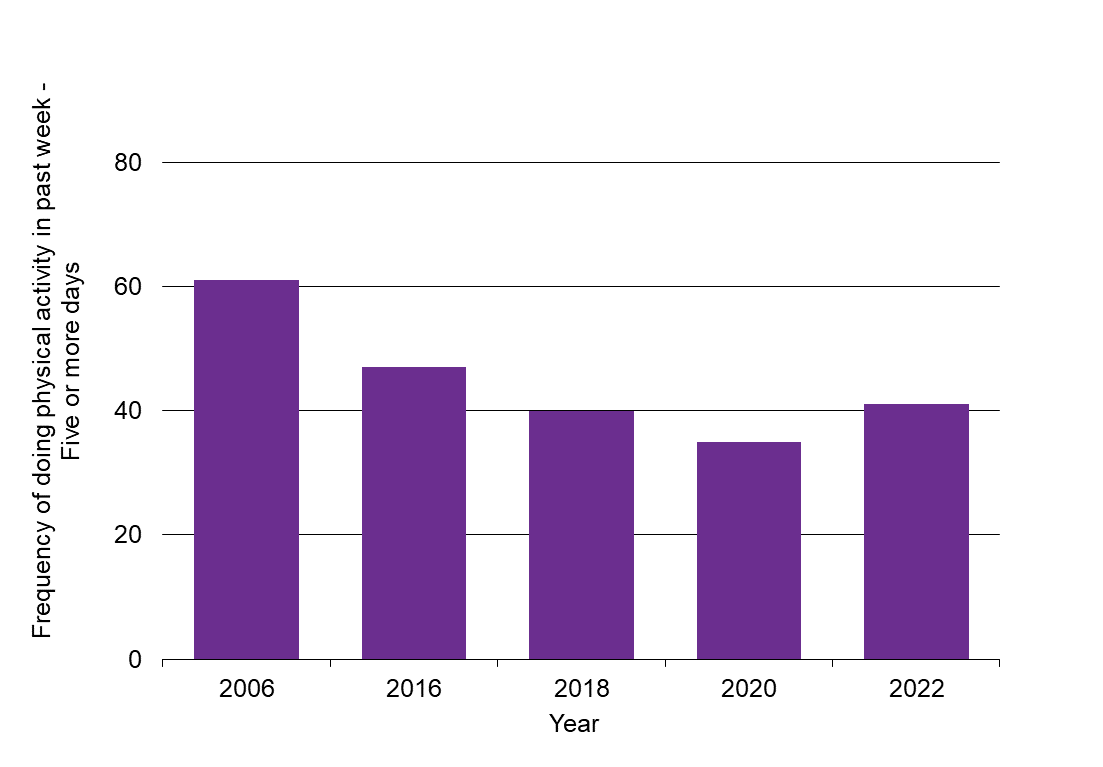
| Year | Frequency of doing physical activity in past week - five or more days |
| 2006 | 61 |
| 2016 | 47 |
| 2018 | 40 |
| 2020 | 35 |
| 2022 | 41 |
| 2024 | 31 |
Note: Caution needed when comparing results since 2020 to prior years due to differences in question wording. Prior wording: "Thinking about all your physical activity over the last 7 days (not including today), on how many days did you engage in....? a) At least 30 minutes of moderate activity - 'moderate' activities might make you breathe harder than normal, but only a little - like brisk walking, carrying light loads, cycling at a regular pace, or other activities like table tennis. OR b) At least 15 minutes of vigorous activity - 'vigorous' activities make you breathe a lot harder than normal ('huff and puff') – like running, heavy lifting, digging, aerobics, fast cycling, or other activities like rugby or netball." Question since 2020: "In the past week, on how many days have you done a total of 30 minutes or more of physical activity, which was enough to raise your breathing rate?"
What is this indicator telling us?
- Compared to 2006, Waikato regional survey respondents in 2024 were less likely to report having been physically activity on five or more of the past seven days (31% compared to 61% in 2006).
- Across the Waikato region in 2024:
- The percentage of people who reported having been physically activity on five or more of the past seven days ranged from 24% in Hauraki district up to 46% in the rural part of the Rotorua district that is within the Waikato region. These territorial authority level figures are based on a relatively small number of responses.
- Respondents aged 25-34 were less likely to report having been physically active on five or more of the last seven days (24%).
DATA SOURCE AND SUPPORTING INFORMATION
Physical activity is measured as the percentage of respondents who reported that they were physical activity on five or more of the past seven days. Data are from the Quality of Life Survey.
Caution is needed when comparing results from 2020 to prior years due to differences in question wording.
- Prior wording: ‘Thinking about ALL your physical activities (including any physical tasks you might do at work, doing housework or gardening, travelling from place to place or playing sports), on how many of the last 7 days were you active? By “active” we mean doing 15 minutes or more of vigorous activity, which makes you breathe a lot harder than normal, “huff and puff” like running, OR 30 minutes or more of moderate physical activity which makes you breathe harder than normal, but only a little, like brisk walking. Other examples of moderate physical activity include carrying light loads, cycling at a regular pace, recreational swimming and gardening.’
- Wording since 2020: ‘In the past week, on how many days have you done a total of 30 minutes or more of physical activity, which was enough to raise your breathing rate?’
Update details: Waikato regional results are available for 2006, 2016, 2018, 2020, 2022 and 2024.
Customised data request requirements: Quality of Life data.
DATA AVAILABILITY – OTHER THAN WAIKATO REGION:
Territorial Authority (TA) disaggregation: Yes
Other regions: Yes
New Zealand: No (but 8 cities average is available)
Other countries/ Organisation for Economic Co-operation and Development (OECD): No