Community pride

 COMMUNITY PRIDE
| WORSENING TREND |
The level of community pride by people living in the Waikato region was lower in 2024 compared with 2006 levels.
This indicator is the sense of pride reported by people in the Waikato region when asked about the way their city/town looks and feels. It uses information drawn from the Quality of Life Survey.
Why is this indicator important?
This indicator measures how people in the Waikato region feel about various aspects of living in their neighbourhood, city or town and its surrounding environment. People who feel a sense of pride in where they live may be more likely to engage with and contribute to their community, benefitting themselves and others. Measuring levels of community pride can also reveal where extra facilities, support systems or other resources are needed, related to each location’s needs.
Community pride
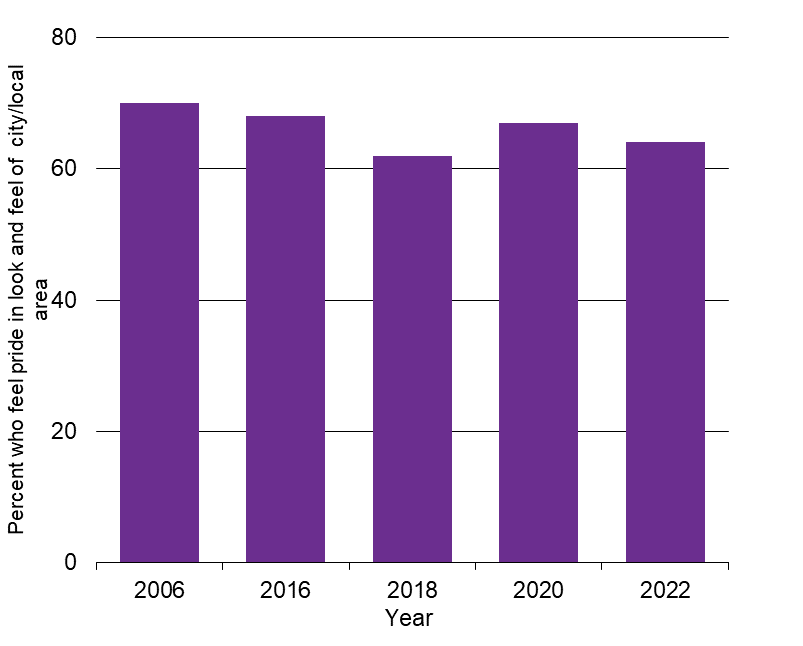
| Year | Per cent |
| 2006 | 70 |
| 2016 | 68 |
| 2018 | 62 |
| 2020 | 67 |
| 2022 | 64 |
| 2024 | 63 |
Note: 2024 Wording change: "I feel really happy with the way <My local area/Hamilton> looks and feels."
What is this indicator telling us?
- Results from the 2024 Quality of Life Survey showed that, across the Waikato region, less than two-thirds (63%) of respondents agreed that they feel really happy with the way their local area looks and feels.
- Community pride in 2024 was lower than in 2006.
- Across the Waikato region in 2024:
- The percentage of respondents who agreed that they feel really happy with the way their local area looks and feels ranged from 47% in Waitomo district and 51% in Hamilton city up to 82% in Matamata-Piako district.
- Respondents aged under 25 years were less likely to agree they feel really happy with the way their local area looks and feels (53%), while people 65 years and over were more likely to agree (72%).
- Respondents who identified with the rainbow community were less likely to agree they feel really happy with the way their local area looks and feels (52%).
DATA SOURCE AND SUPPORTING INFORMATION
Community pride is measured as the percentage of respondents who agree or strongly agree that they feel a sense of pride in the way their city or local area looks and feels. Data are from the Quality of Life Survey. For the 2024 survey, the question wording was changed to "I feel really happy with the way <My local area/Hamilton> looks and feels."
Update details: Waikato regional results are available for 2006, 2016, 2018, 2020, 2022 and 2024.
Customised data request requirements: Quality of Life data.
DATA AVAILABILITY – OTHER THAN WAIKATO REGION:
Territorial Authority (TA) disaggregation: Yes
Other regions: Yes
New Zealand: No (but an 8 cities average is available)
Other countries/ Organisation for Economic Co-operation and Development (OECD): No